
Best Buy Co., Inc. (BBY)
BBY Intrinsic value
BBY Intrinsic value overview

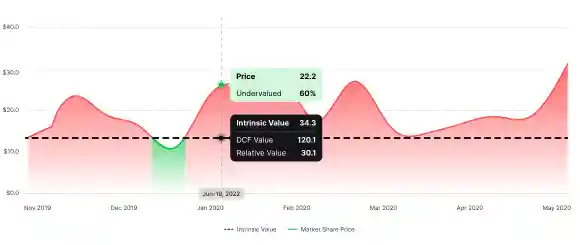
BBY Historical intrinsic value
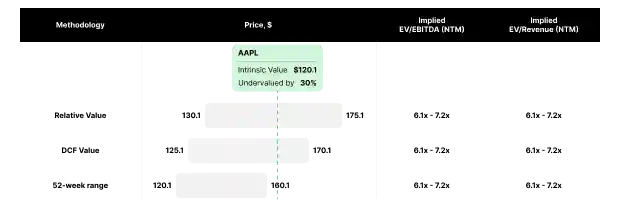
BBY Relative value
BBY Valuation multiples overview
BBY vs Peer Set Valuation Multiples Dynamics
BBY DCF sensitivity
BBY Discount rate (WACC)
Discover more BBY fundamentals

FAQ
What is the DCF value of Best Buy Co., Inc. (BBY)?
As of today, DCF Value of Best Buy Co., Inc. is $71.6, which is undervalued by 48.8%, compared to the current market share price of $98.5
How was the DCF Value calculated?
Step 1: Calculating Intrinsic Enterprise Value DCF Value was calculated by estimating Best Buy Co., Inc. future free cash flow and then discounting it, using a chosen discount rate to determine Intrinsic Enterprise Value of 12.8B Step 2: Balance Sheet Adjustments Intrinsic Equity Value is calculated by subtracting Balance Sheet items (Cash & Equivalents, Short-term investments and Total Debt) from previously calculated Intrinsic Enterprise Value. This Intrinsic Equity Value is then divided by the total number of outstanding shares of 216000000 to determine DCF Value of $71.6
What is the Relative value of Best Buy Co., Inc. (BBY)?
As of today, Relative Value of Best Buy Co., Inc. is $312.6, which is overvalued by 217.6%, compared to the current market share price of $98.5
How was the Relative Value calculated?
Relative Value was calculated by applying various valuation multiples (EV/Revenue, EV/EBITDA, P/E etc.) to Best Buy Co., Inc. financials to determine Relative Value of $312.6
What is Best Buy Co., Inc. (BBY) discount rate?
Best Buy Co., Inc. current Cost of Equity is 11.6%, while its WACC stands at 10.0%. Cost of Equity is used to value equity, while discounting free cash flow to equity holders (such as Net Income or Free Cash Flow to Equity). Weighted Average Cost of Capital (WACC) is used to value the entire firm, while discounting cash flows available to both debt and equity holders (NOPAT or Free Cash Flow to the Firm)
How is Cost of Equity for Best Buy Co., Inc. (BBY) calculated?
The Cost of Equity represents the return a company must offer investors to compensate for the risk of investing in its stock. It's calculated using the Capital Asset Pricing Model (CAPM), which combines the risk-free rate, the stock's beta, and the equity risk premium (ERP). This model considers the inherent risk of investing in the stock compared to a risk-free investment and the market's overall risk. Cost of Equity = Risk-Free Rate + Beta x Effective Risk Premium (ERP) 11.6% = 4.13% + 1.5 x 5%
How is WACC for Best Buy Co., Inc. (BBY) calculated?
WACC, or Weighted Average Cost of Capital, is a calculation that reflects the average rate of return a company is expected to pay its security holders to finance its assets. It is a critical measure in financial analysis for valuing a company’s entire operations. The WACC formula combines the costs of equity and debt, weighted by their respective proportions in the company's capital structure. WACC = Cost of Equity x Equity Weight in Total Capital + Cost of Debt x (1 - Effective Tax Rate) Debt Weight in Total Capital 10.0% = 11.6% x 84.2% + 1.8% x (1 - 19.3%) x 15.8%