
Best Buy Co., Inc. (BBY)
Last Price$98.450.7%
Market Cap$21.6bn
BBY overview
Crunching data... Almost there!
BBY Intrinsic value
BBY Intrinsic value overview
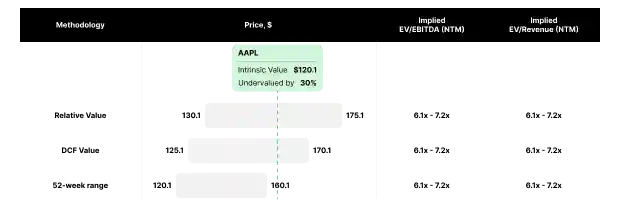

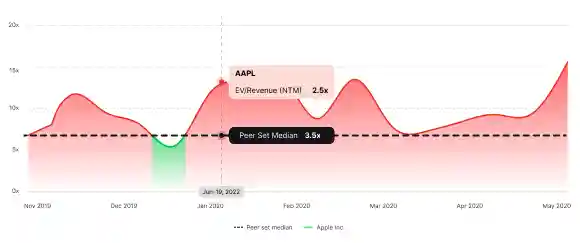
BBY Historical intrinsic value
BBY Financials
BBY Income statement
Crunching data... Almost there!
BBY Balance sheet
Crunching data... Almost there!
BBY Cash flow statement
Crunching data... Almost there!
BBY Financial ratios
BBY Growth
Crunching data... Almost there!
BBY Returns on capital
Crunching data... Almost there!
Compare with peers: operational metrics
Growth & profitability
Solvency & returns
Crunching data... Almost there!
Wall Street estimates
Price target
Crunching data... Almost there!
Crunching data... Almost there!
EPS Surprises
Crunching data... Almost there!
Looking for the most undervalued companies?
Here's our top picks.
Crunching data... Almost there!
Discover more BBY fundamentals

Stock picking tips.
Ultimate guide 2024
Discover the secrets to successful stock picking in 2024!
We asked 1,000 top investors for their insights on the best stocks, investment strategies, and market trends.
FAQ
What is the Intrinsic Value of Best Buy Co., Inc. (BBY) stock?
As of today, intrinsic value of Best Buy Co., Inc. is $192.1.
Is Best Buy Co., Inc. (BBY) stock undervalued or overvalued?
As of today, Best Buy Co., Inc. is undervalued by 48.8%, compared to the current market share price of $98.45.
What is Best Buy Co., Inc. (BBY) stock rating?
As of today, Best Buy Co., Inc. has a stock rating of 5 (out of 10), which is considered Good.
is Best Buy Co., Inc. (BBY) a good stock to buy?
As of today, Best Buy Co., Inc. has a Good stock rating, which is 48.8% undervalued. According to Value Sense backtesting, stocks with similar profile tend to outperform the market by 3.2%.